
We lined up 2025 national park visits against the Eras Tour’s ticket counts — here’s what surprised us.
Illustrations are AI-generated; every number is set from NPS and Guinness data.
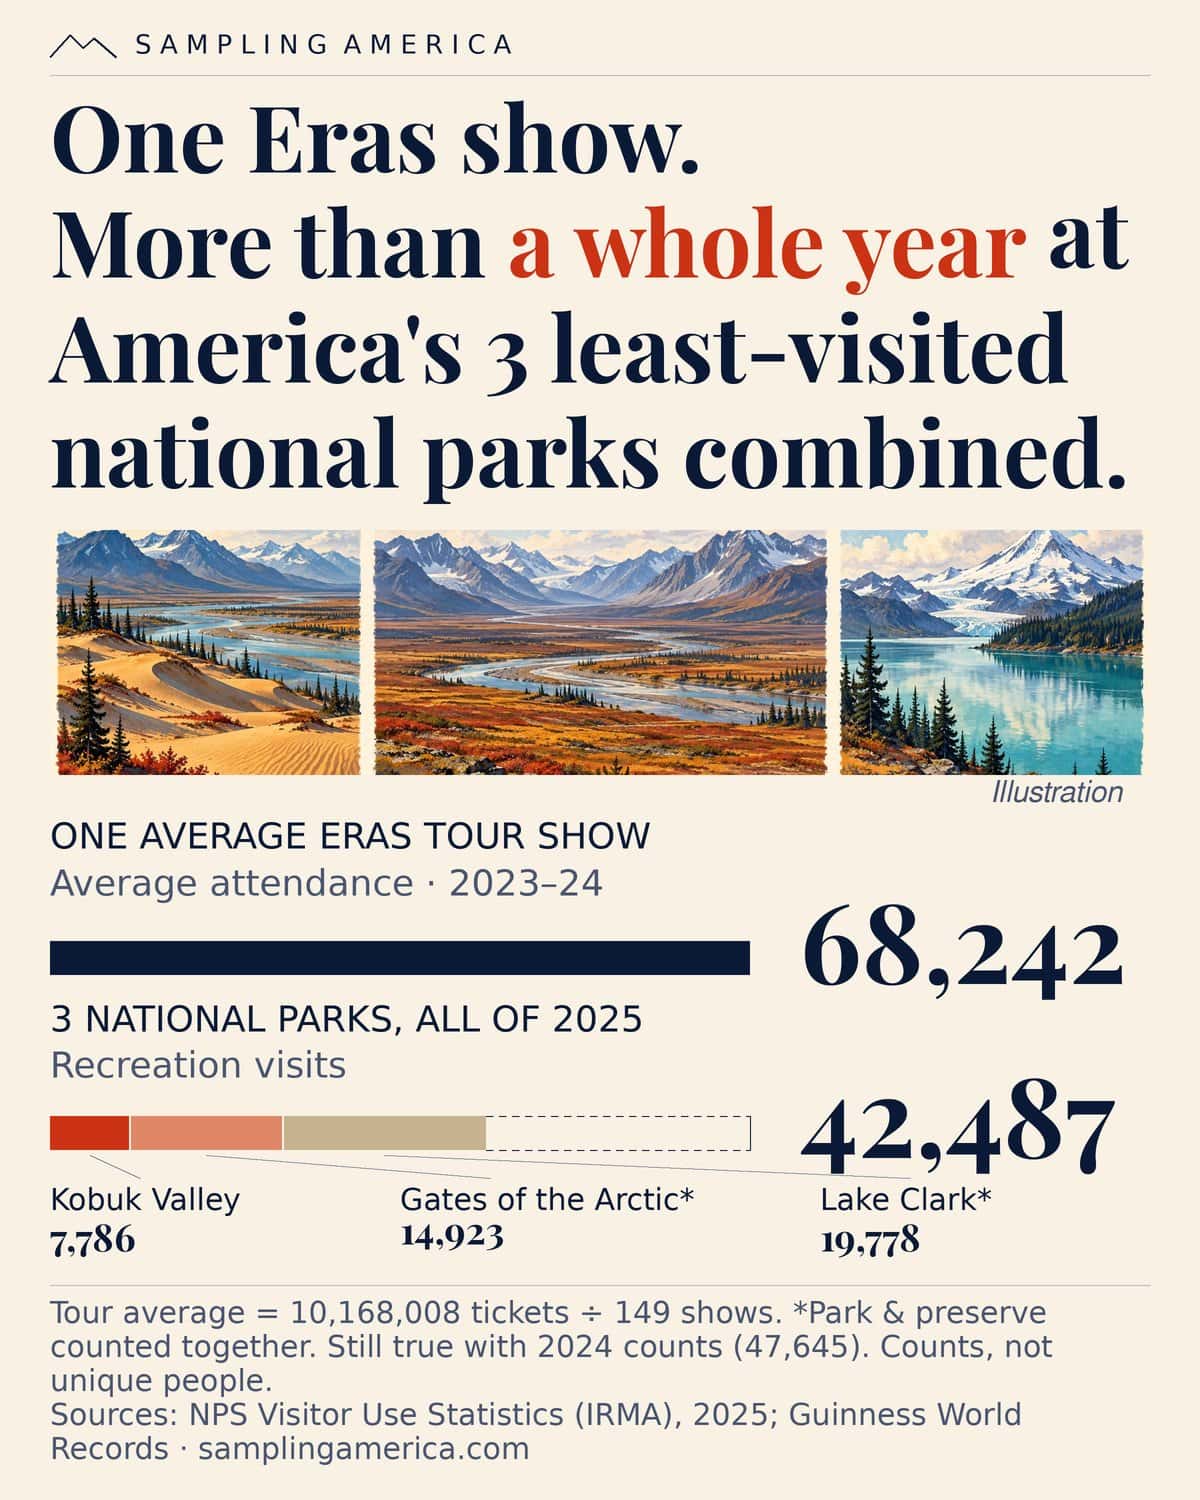
Gates of the Arctic and Lake Clark include their preserves. Kobuk’s count fell sharply from 17,233 in 2024, mainly in the off-season, and we found no published NPS explanation. Using all three parks’ 2024 counts gives a combined 47,645, so the comparison still holds.
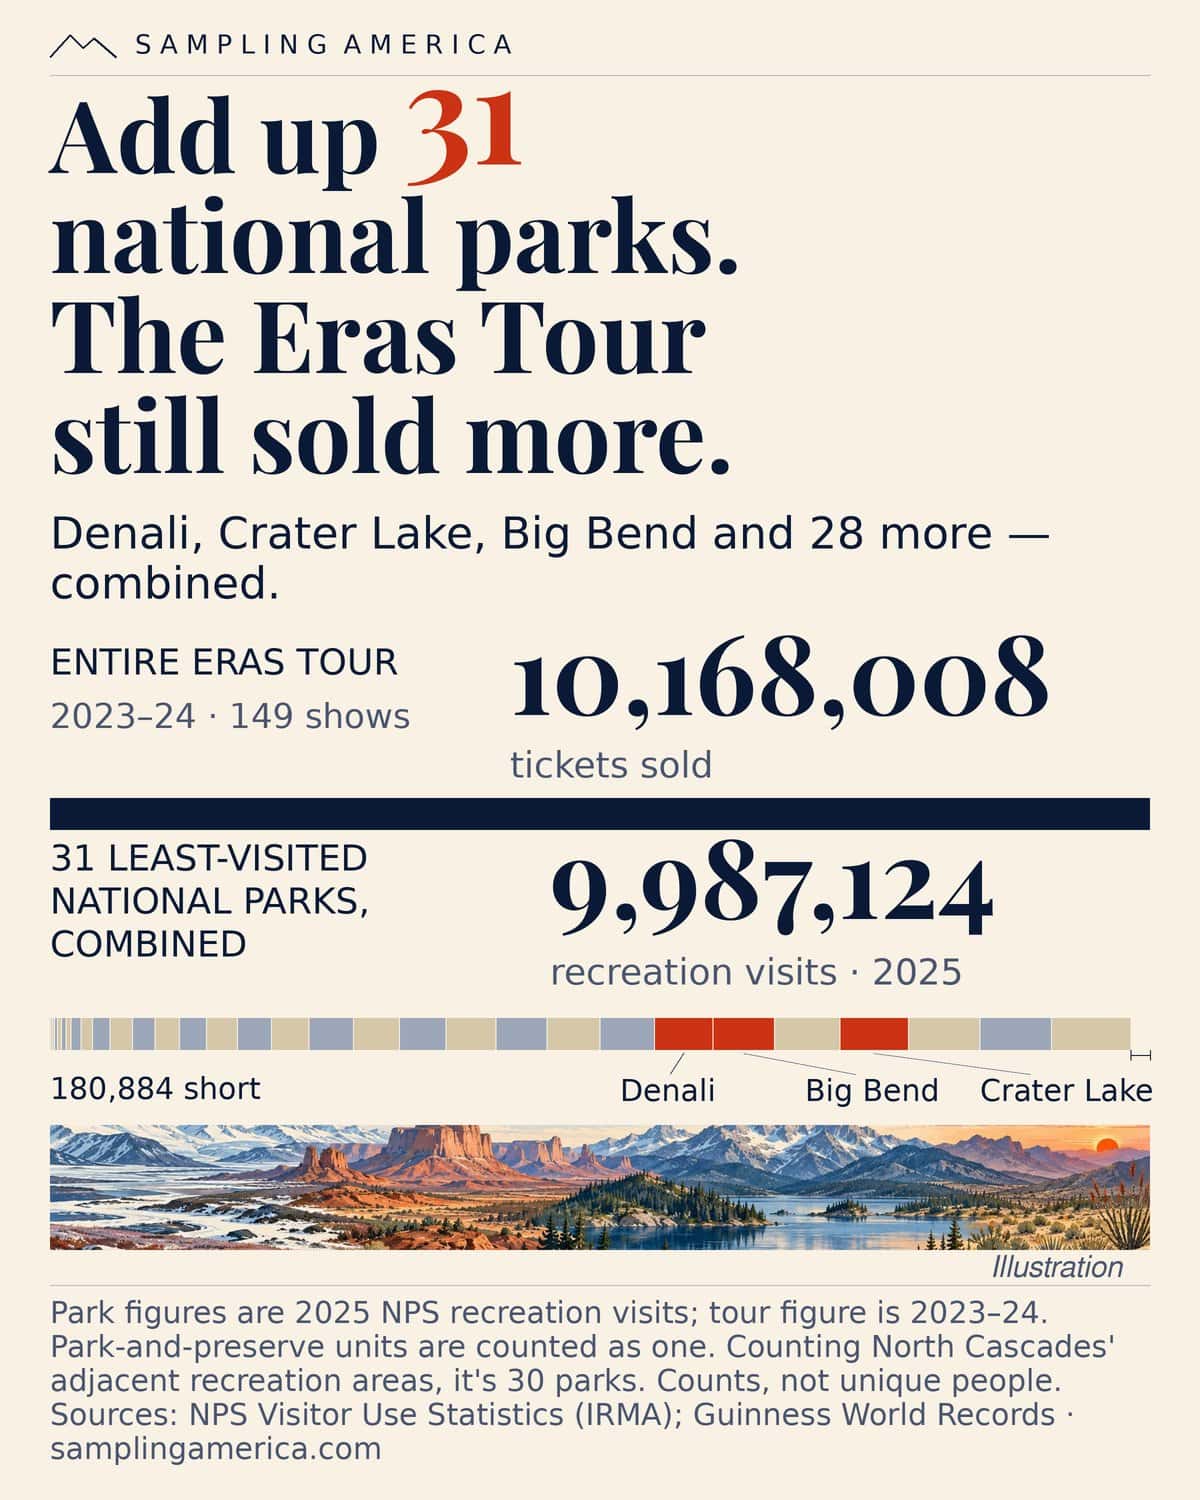
North Cascades is managed with two neighboring recreation areas, whose visits are reported separately. Count that whole complex together and the number of parks that fall short becomes 30.
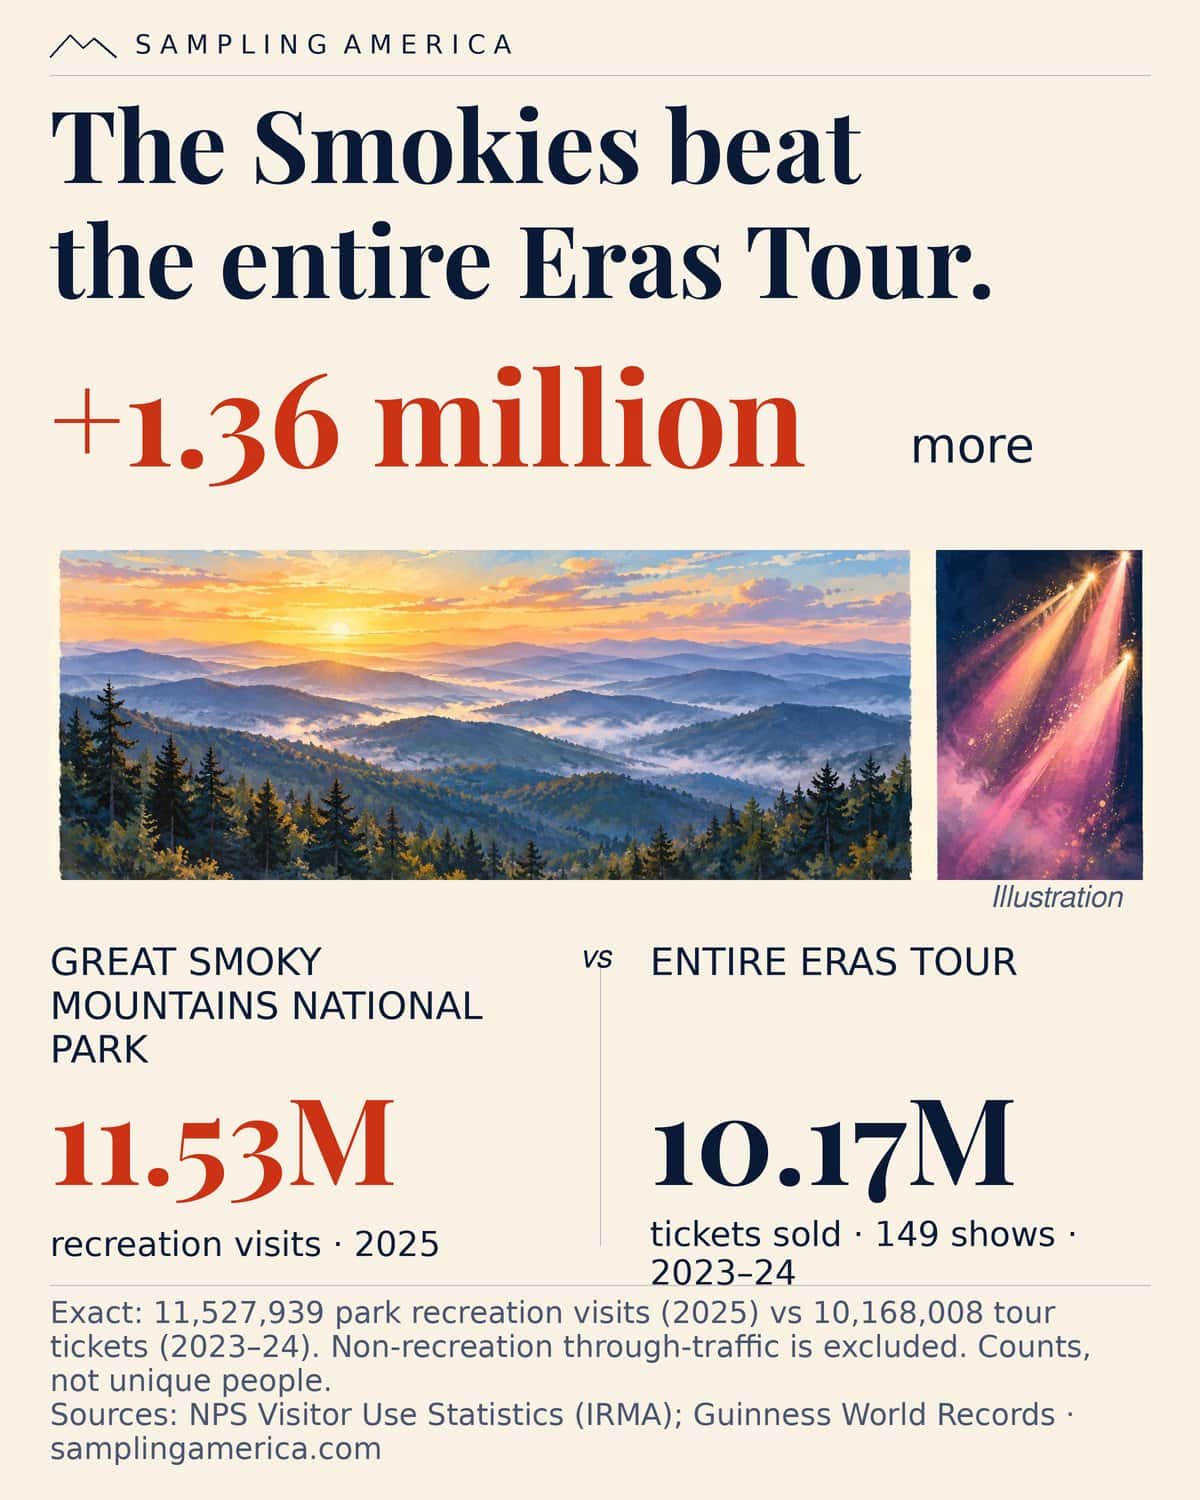
A park entry and a ticket sale are different measures, and neither tells us how many unique people attended. The Smokies figure excludes non-recreation through-traffic.
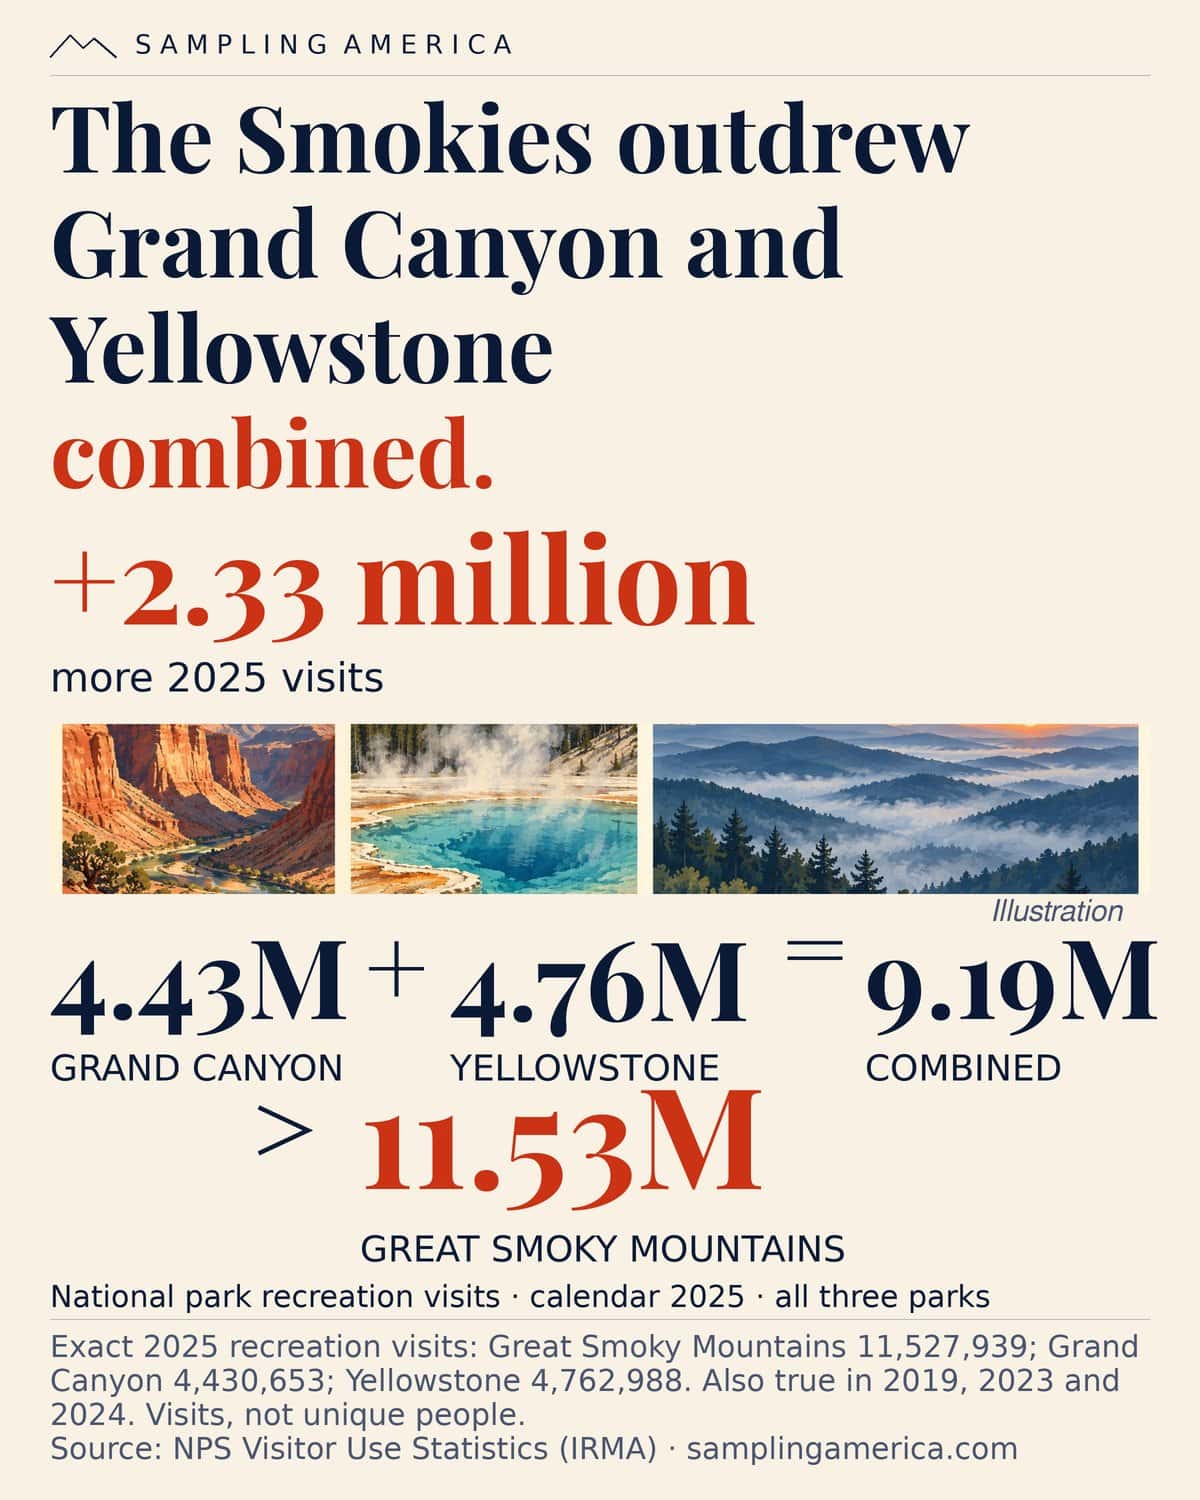
The Dragon Bravo Fire closed Grand Canyon’s North Rim for the rest of the 2025 season, affecting that year’s comparison. The Smokies also led the combined parks in the earlier years checked, before that fire.
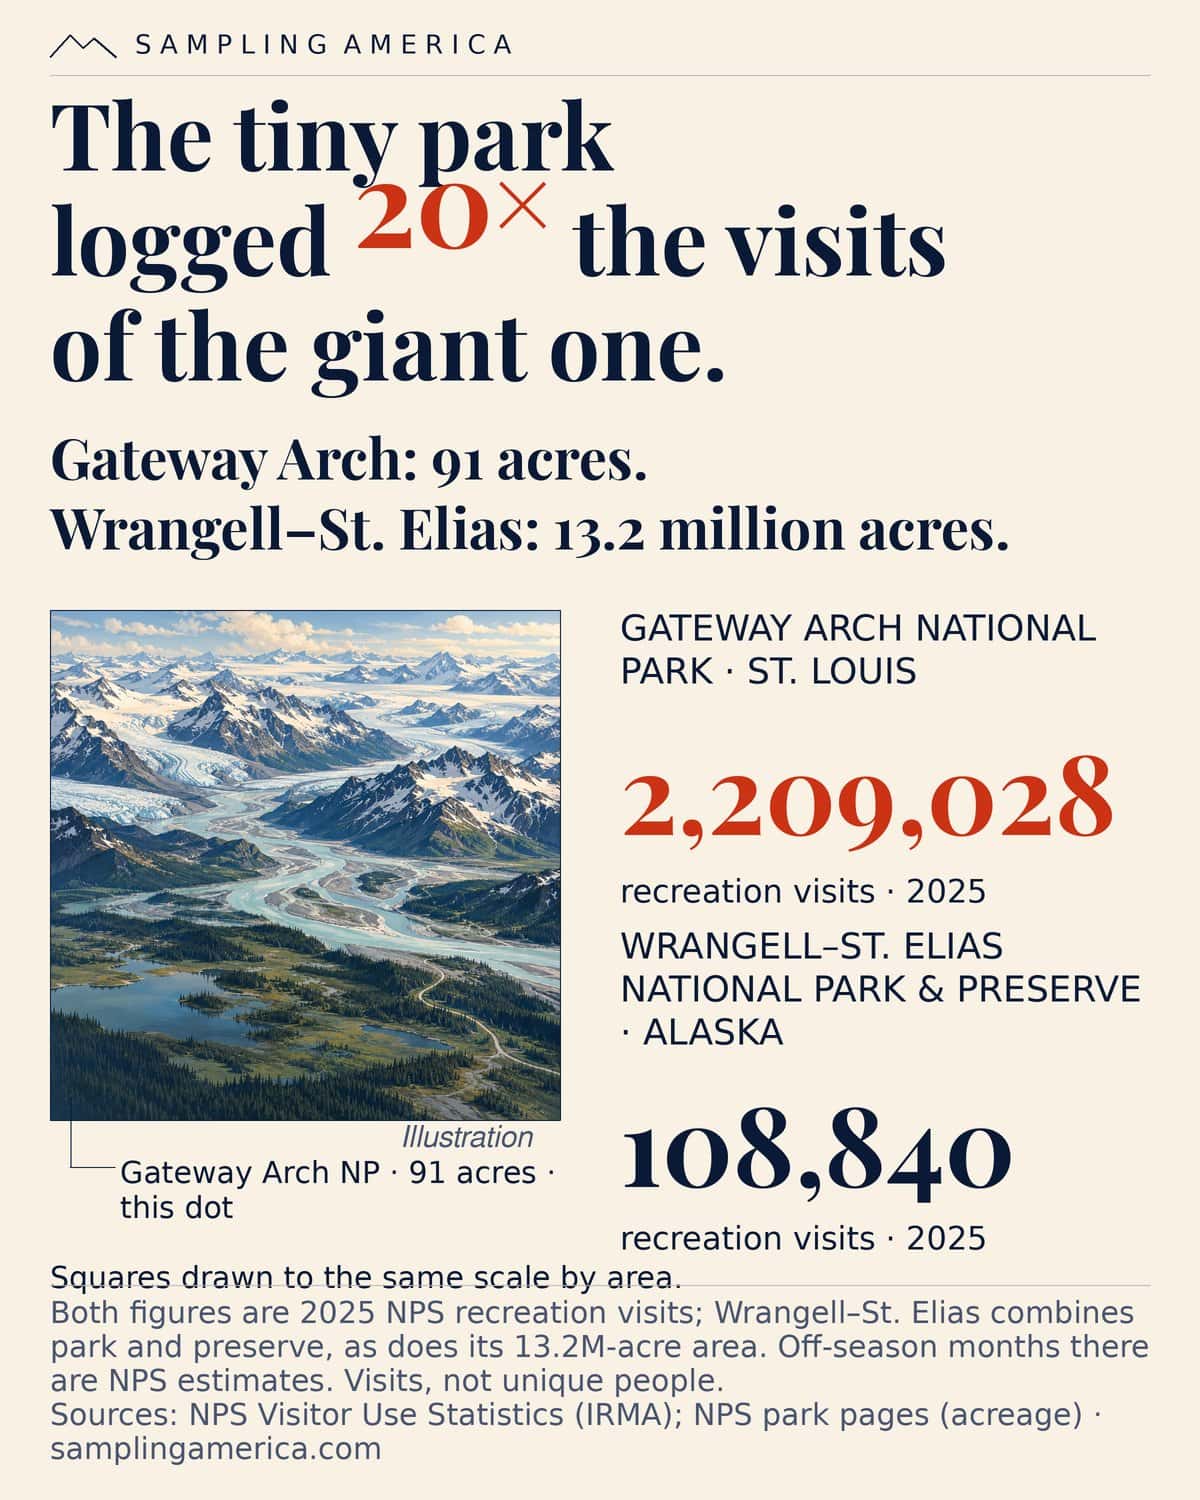
Wrangell–St. Elias uses NPS estimates for off-season months; those monthly figures repeat the previous year’s values. Its visit count and acreage both include the preserve.
All 63 national parks
Ranked from fewest to most 2025 recreation visits. *Park and preserve counted together. “≈ Eras shows” uses the unrounded per-show ticket average.
| Rank | Park | 2025 visits | 2024 visits | ≈ Eras shows |
|---|---|---|---|---|
| 1 | Kobuk Valley National Park | 7,786 | 17,233 | 0.1 |
| 2 | Gates of the Arctic National Park & Preserve* | 14,923 | 11,907 | 0.2 |
| 3 | Lake Clark National Park & Preserve* | 19,778 | 18,505 | 0.3 |
| 4 | Isle Royale National Park | 29,091 | 28,806 | 0.4 |
| 5 | Katmai National Park & Preserve* | 34,479 | 36,230 | 0.5 |
| 6 | National Park of American Samoa | 43,258 | 22,567 | 0.6 |
| 7 | North Cascades National Park | 46,925 | 16,485 | 0.7 |
| 8 | Dry Tortugas National Park | 89,355 | 84,873 | 1.3 |
| 9 | Wrangell-St. Elias National Park & Preserve* | 108,840 | 81,670 | 1.6 |
| 10 | Great Basin National Park | 161,210 | 152,068 | 2.4 |
| 11 | Voyageurs National Park | 206,326 | 199,030 | 3.0 |
| 12 | Guadalupe Mountains National Park | 206,423 | 226,134 | 3.0 |
| 13 | Channel Islands National Park | 227,186 | 262,581 | 3.3 |
| 14 | Black Canyon of the Gunnison National Park | 250,086 | 335,862 | 3.7 |
| 15 | Congaree National Park | 287,833 | 242,049 | 4.2 |
| 16 | Petrified Forest National Park | 315,951 | 559,254 | 4.6 |
| 17 | Pinnacles National Park | 343,208 | 354,076 | 5.0 |
| 18 | Carlsbad Caverns National Park | 410,778 | 460,474 | 6.0 |
| 19 | Kenai Fjords National Park | 425,369 | 419,468 | 6.2 |
| 20 | Great Sand Dunes National Park & Preserve* | 432,498 | 437,661 | 6.3 |
| 21 | Mesa Verde National Park | 463,130 | 480,065 | 6.8 |
| 22 | Virgin Islands National Park | 471,074 | 423,029 | 6.9 |
| 23 | Biscayne National Park | 486,567 | 512,213 | 7.1 |
| 24 | Lassen Volcanic National Park | 504,777 | 357,651 | 7.4 |
| 25 | Denali National Park & Preserve* | 543,300 | 466,227 | 8.0 |
| 26 | Big Bend National Park | 568,104 | 561,458 | 8.3 |
| 27 | Wind Cave National Park | 606,258 | 489,399 | 8.9 |
| 28 | Crater Lake National Park | 632,242 | 504,942 | 9.3 |
| 29 | White Sands National Park | 659,742 | 702,236 | 9.7 |
| 30 | Mammoth Cave National Park | 660,734 | 747,042 | 9.7 |
| 31 | Theodore Roosevelt National Park | 729,893 | 732,951 | 10.7 |
| 32 | Glacier Bay National Park & Preserve* | 740,044 | 736,282 | 10.8 |
| 33 | Everglades National Park | 778,198 | 741,983 | 11.4 |
| 34 | Kings Canyon National Park | 779,791 | 699,389 | 11.4 |
| 35 | Canyonlands National Park | 796,057 | 818,492 | 11.7 |
| 36 | Saguaro National Park | 847,749 | 946,369 | 12.4 |
| 37 | Haleakala National Park | 853,711 | 732,477 | 12.5 |
| 38 | Badlands National Park | 1,139,361 | 1,094,245 | 16.7 |
| 39 | Redwood National Park | 1,202,480 | 622,883 | 17.6 |
| 40 | Death Valley National Park | 1,320,134 | 1,440,484 | 19.3 |
| 41 | Sequoia National Park | 1,378,337 | 1,309,573 | 20.2 |
| 42 | Capitol Reef National Park | 1,388,476 | 1,422,490 | 20.3 |
| 43 | Arches National Park | 1,511,740 | 1,466,528 | 22.2 |
| 44 | Mount Rainier National Park | 1,635,342 | 1,620,006 | 24.0 |
| 45 | Shenandoah National Park | 1,682,152 | 1,720,211 | 24.6 |
| 46 | Hawaii Volcanoes National Park | 1,877,854 | 1,433,593 | 27.5 |
| 47 | New River Gorge National Park & Preserve* | 1,958,440 | 1,811,937 | 28.7 |
| 48 | Bryce Canyon National Park | 1,967,367 | 2,498,075 | 28.8 |
| 49 | Gateway Arch National Park | 2,209,028 | 2,563,052 | 32.4 |
| 50 | Hot Springs National Park | 2,494,611 | 2,461,812 | 36.6 |
| 51 | Indiana Dunes National Park | 2,629,497 | 2,705,209 | 38.5 |
| 52 | Joshua Tree National Park | 2,932,644 | 2,991,874 | 43.0 |
| 53 | Cuyahoga Valley National Park | 3,025,325 | 2,912,454 | 44.3 |
| 54 | Glacier National Park | 3,136,557 | 3,208,755 | 46.0 |
| 55 | Olympic National Park | 3,584,187 | 3,717,267 | 52.5 |
| 56 | Grand Teton National Park | 3,800,648 | 3,628,222 | 55.7 |
| 57 | Acadia National Park | 4,079,318 | 3,961,661 | 59.8 |
| 58 | Rocky Mountain National Park | 4,171,431 | 4,154,349 | 61.1 |
| 59 | Yosemite National Park | 4,278,413 | 4,121,807 | 62.7 |
| 60 | Grand Canyon National Park | 4,430,653 | 4,919,163 | 64.9 |
| 61 | Yellowstone National Park | 4,762,988 | 4,744,353 | 69.8 |
| 62 | Zion National Park | 4,984,525 | 4,946,592 | 73.0 |
| 63 | Great Smoky Mountains National Park | 11,527,939 | 12,191,834 | 168.9 |
Methodology and sources
Data pulled October 30, 2026. We summed the twelve monthly NPS recreation-visit counts for each national park, combining park-and-preserve units as reported by NPS. The comparisons use 63 national parks, ranked by their 2025 totals. These are entry counts, not measures of popularity or unique people.
The tour average is 10,168,008 tickets divided by 149 shows. Calculations use the unrounded result; graphics show 68,242. Values marked M are rounded to millions. The tour ran from March 17, 2023, to December 8, 2024.
IRMA REST URL pattern (replace the unit code and year): https://irmaservices.nps.gov/v3/rest/stats/visitation?unitCodes=GRSM&startMonth=1&startYear=2025&endMonth=12&endYear=2025.
- Guinness World Records: Eras Tour ticket sales and average attendance
- NPS annual visitation highlights and counting limitations
- North Cascades National Park Service Complex
- Gateway Arch acreage and Wrangell–St. Elias acreage